
To track Google Lens and Image Search performance, open the Search results performance report in Google Search Console. Choose Web: multimodal for image-led searches that include Google Lens, or Image for results in the Google Images tab.
Keep the two views separate in your reports. The multimodal filter combines several ways people search with images, so its total covers more than Lens. This guide shows how to pull each view, interpret the numbers and use them to improve landing pages.
Table of Contents
1. Choose the right search type
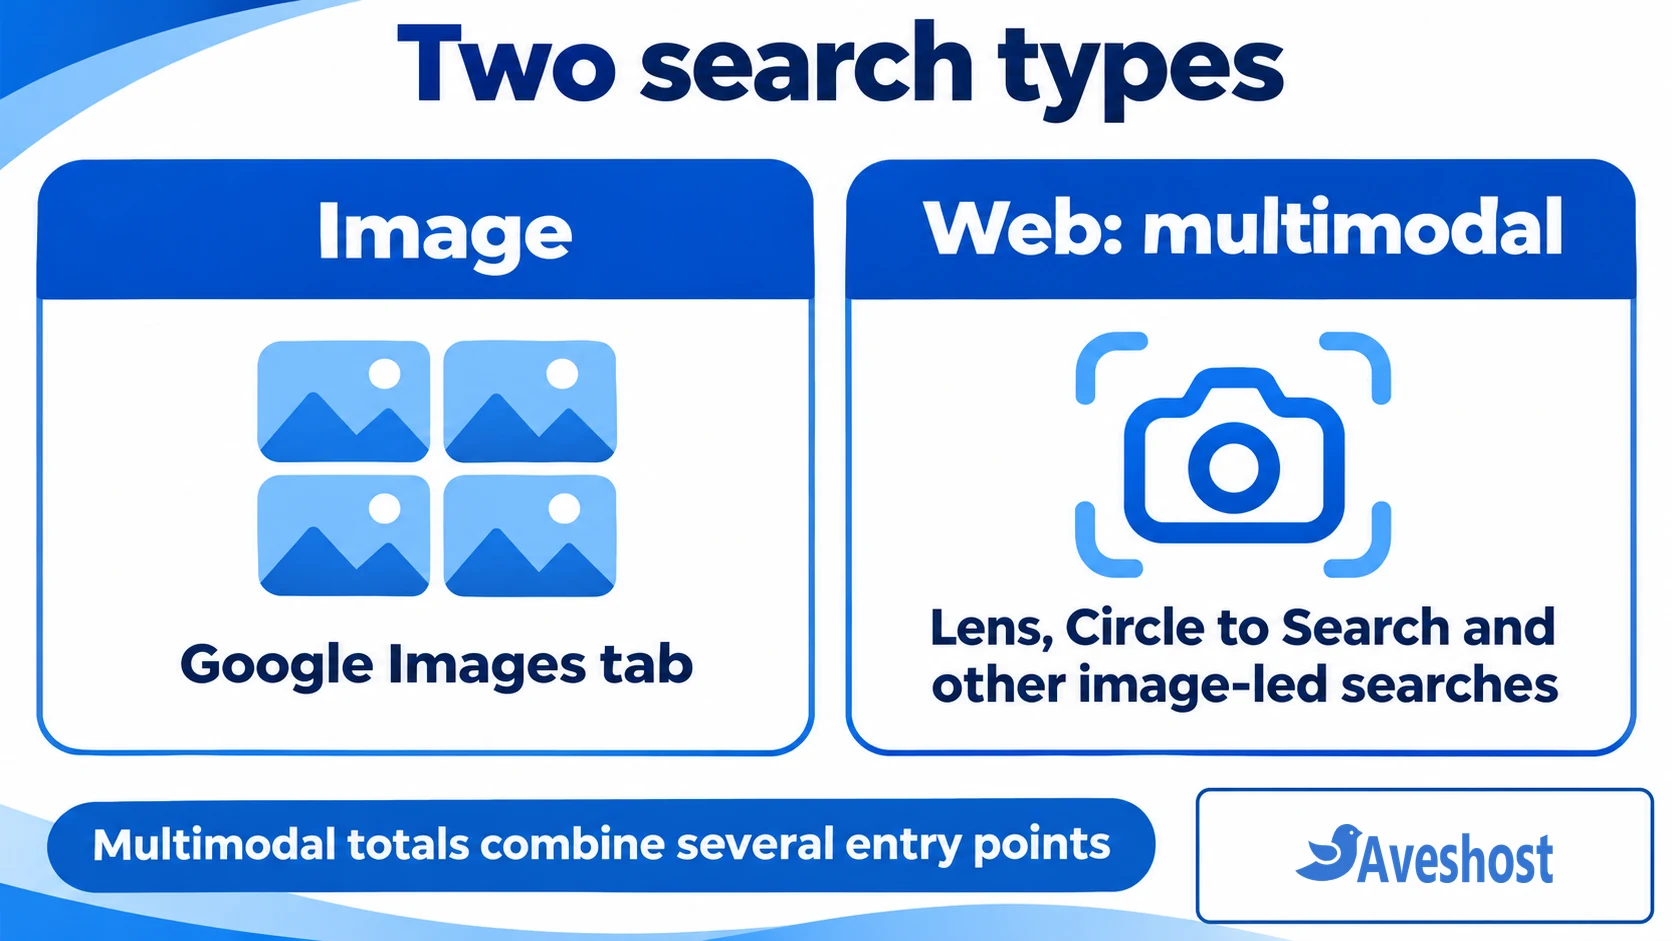
The distinction comes down to how someone searched and where Google showed the result. Someone can type “blue ceramic bowl” and open the Images tab. That tab belongs to the Image search type. A shopper who uses a photo of a bowl to start a search through Lens uses one of the entry points covered by Web: multimodal.
Google groups Lens with Circle to Search on Android, images uploaded to Google Search and Chrome’s image search feature. Use the label Web: multimodal in your dashboard so readers know what the total includes. The filter does not break out clicks for each entry point. See Google’s multimodal reporting announcement for coverage.
| Search type | Use it to measure |
|---|---|
| Image | Performance in the Google Images tab |
| Web: multimodal | Combined web performance for image-led searches, including Lens |
| Web: text-based | Performance from text queries in standard Google Search |
2. Find Google Lens data in Search Console
Open Google Search Console and select the property that covers the landing pages you want to measure. Open Performance → Search results, then open Search type. Select Web: multimodal and apply the filter. Confirm that the filter chip reflects your selection before reading or exporting the totals.
Start with clicks and impressions and a broad date range. Open Pages to see which URLs contribute to the total. Pick one page to narrow the report and use Countries or Devices when you have a specific question, such as whether impressions for a product category are concentrated on mobile.
If you cannot see meaningful data, remove other filters, confirm the property and widen the range. A newer reporting type may have less history than older ones. An empty view cannot tell you whether an individual photo appears in a Lens result. Use the Performance report documentation to confirm the available filters.
3. Measure traffic from Google Images
In the same report, change Search type to Image and apply it. Check the date range again. Open Pages to identify the destination URLs that receive impressions and clicks from the Images tab. Google explains this distinction in its guide to Search Console performance reports.
A row for /products/blue-bowl/ describes the page that hosts or represents the image result. It is not a report for a specific WebP or JPEG. If that product page contains six photos, the row cannot identify which one earned the click. When you run an image update, document exactly which assets changed so you can interpret later page-level changes.
Use visible query rows to see how people describe what they are looking for. Check whether the landing page meets that need. A query for a product close-up suggests a different page experience from a query for dimensions or setup instructions. Some queries are omitted from the table for privacy, so the visible rows may add up to less than the chart total.
4. Read clicks, impressions, CTR and position
Impressions measure visibility under the counting rules for the selected result type. Clicks measure clicks through to your site. A user can interact with an image inside Google without visiting your page. CTR divides clicks by impressions, while average position summarizes where eligible results appeared. See how Google counts these metrics.
Read the numbers together. For example, 48 clicks from 2,400 impressions gives a CTR of 2%. If the next period has 60 clicks from 4,000 impressions, CTR is 1.5%. Clicks and visibility grew even as a smaller share of impressions led to visits. Check which pages account for the extra impressions before making a change.
Compare position within the same search type and comparable filters. Visual results can appear in different layouts, and a site’s average can move when its mix of visible pages or searches changes. A one-point difference between two search types does not establish that one ranks better overall.
5. Compare equal periods and export the results
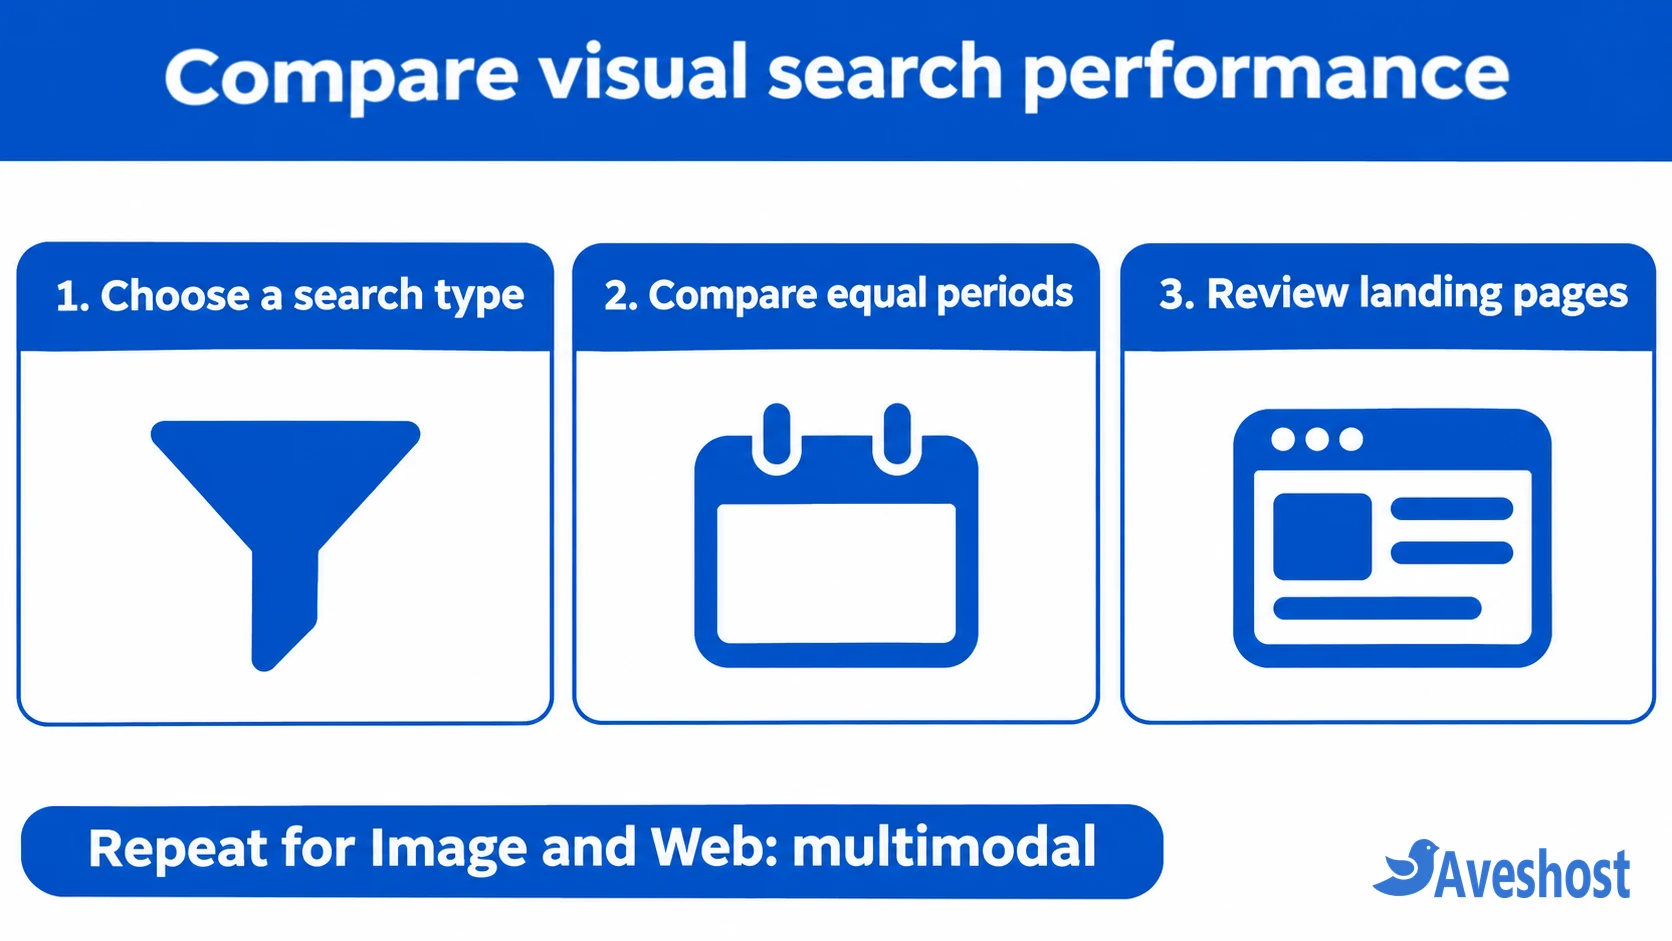
Choose one search type and open Date → Compare. Select matching periods, such as a complete 28-day window and the preceding 28 days. Keep page, country and device filters consistent. Repeat for the other search type using the same windows. If your store is seasonal, compare equivalent periods when history permits.
Use Export and label each download with the property, search type, dates and filters. Keep property totals separate from sums of exported rows. Set up a worksheet with one row per period and search type, then keep a second worksheet for the landing pages you plan to monitor.
Start with pages that gained or lost the most clicks, then check impressions and CTR. For larger reporting workflows, Google’s Search Analytics API update documents the webMultimodal search type. The Image report uses its own search type, so keep the distinction in automated exports too.
6. Use page data to decide what to improve
For pages with rising impressions and weak click growth, inspect whether the main image makes the subject easy to recognize and whether the page answers the likely next question. For a product, that could mean a clear hero photo, a close-up of a distinctive detail and visible specifications or availability. Give useful images descriptive alt text that conveys their purpose.
When impressions fall across several pages, check for recent template or CDN changes. Make sure relevant images load in standard HTML image elements and remain accessible to Google. Use URL Inspection on the landing page for indexing and canonical evidence. It helps check the URL and rendered page. It does not provide a ranking or traffic history for each photo. Follow Google’s image SEO guidance and our guide to diagnosing page indexing issues.
Record the pages changed, what you changed and the baseline for each search type. Check another complete period before deciding whether the trend held. Compare against similar pages you left alone when you can. Even a clean before-and-after comparison can reflect changes in demand, indexing or result layouts.
7. Measure what visitors do after they arrive
Use Search Console to measure discovery and Google Analytics to see whether visitors engage, submit a form or buy. Review the same landing pages and dates in GA4. Search clicks and analytics sessions use different counting rules, so compare patterns rather than expecting matching totals. Google explains how to use both tools together.
A page that gained multimodal clicks and also recorded more organic sales is a good candidate for closer review. Those page totals alone do not establish which sales started in Google Lens. In a monthly report, show Image and Web: multimodal search performance next to the landing page’s separately measured outcomes. That gives your team evidence for deciding which images and pages to work on next.
Frequently asked questions
Does Search Console show Google Lens traffic?
The Web: multimodal search type includes Google Lens. It also includes other image-led entry points such as Circle to Search on Android and uploads in Google Search. Use the combined total for multimodal reporting.
Is Web: multimodal the same as Image?
They measure different search activity. Web: multimodal covers web results from searches that begin with an image. Image covers results shown in the Google Images tab.
Can I see clicks for an individual image file?
The Pages table groups performance by page URL. It does not reveal which specific photo on a product or article page generated a click.
Why is my multimodal report empty?
Start by confirming the property, removing narrow filters and selecting a longer date range. The view needs reportable activity in the selected period. An empty report gives you no image-level indexing verdict.
How often should I check visual search performance?
A monthly comparison using complete, equal periods works well for many sites. Check again after substantial image or template changes. Use longer windows when traffic is sparse.