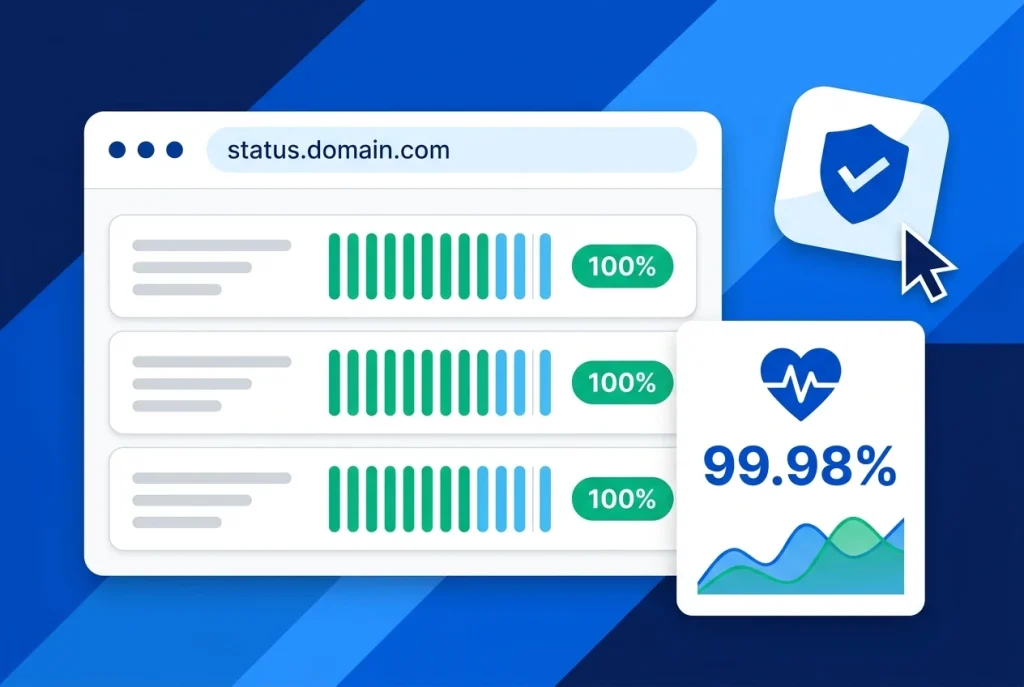
Setting up a public website status page with Uptime Kuma gives your customers, developers, and stakeholders a transparent, real-time window into the health of your websites, APIs, and mail servers—without paying monthly per-monitor or per-subscriber fees to commercial SaaS status tools.
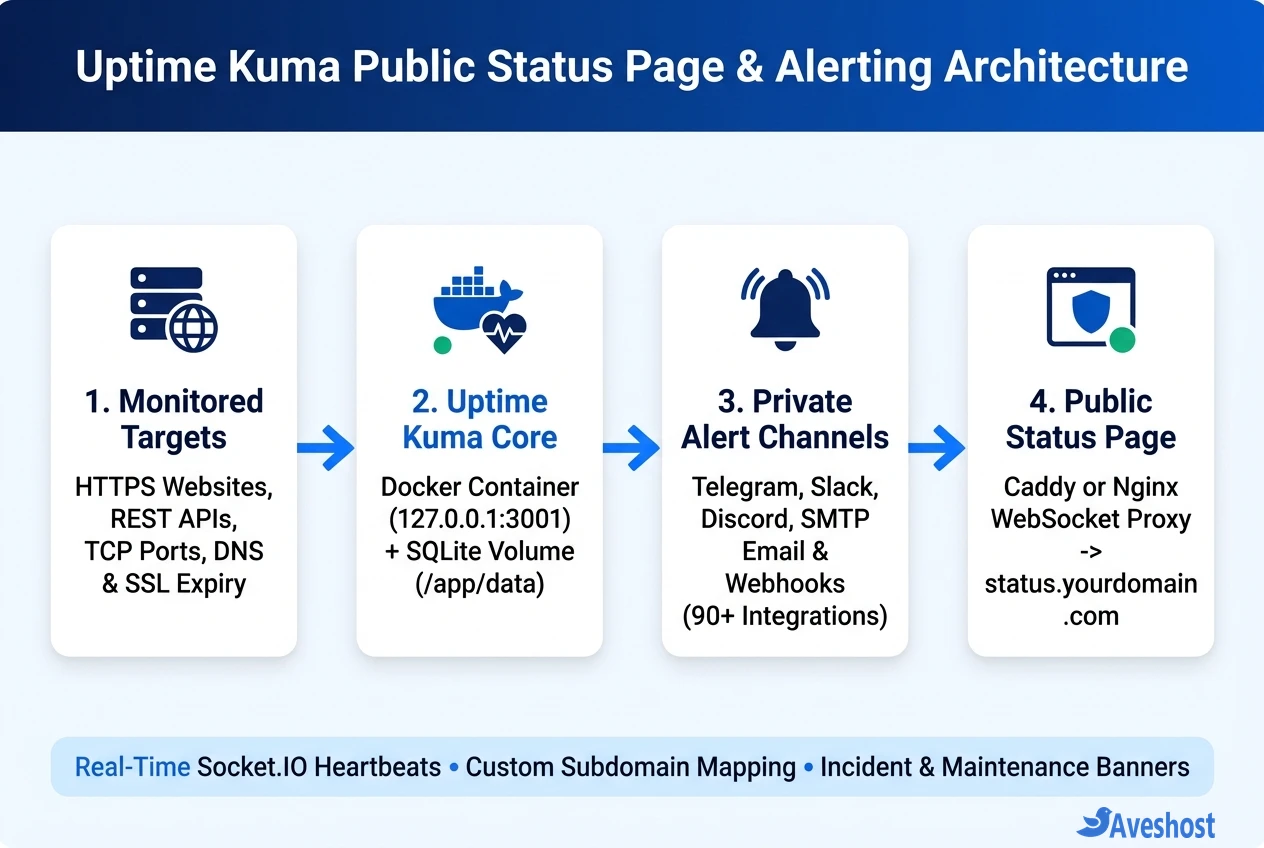
Built by Louis Lam (louislam/uptime-kuma), Uptime Kuma combines sub-minute HTTP/TCP/DNS monitoring, 90+ private notification channels (Telegram, Slack, Discord, Email SMTP, PagerDuty, and Webhooks), SSL certificate expiration alerts, and branded multi-group status pages inside a single lightweight Docker container.
In this tutorial, you will deploy Uptime Kuma on an Aveshost Self-Managed VPS, configure reliable service monitors, build a public website status page with Uptime Kuma, map a custom subdomain like status.yourdomain.com over HTTPS, and post live incident and maintenance updates.
Table of Contents
Why Build a Public Website Status Page with Uptime Kuma?
When an unexpected outage or upstream network issue occurs, customers immediately check whether the problem is on their connection or your server. Publishing a dedicated status page cuts duplicate support tickets and builds long-term trust.
Unlike hosted status pages that charge extra for custom domains, team seats, or SSL monitoring, self-hosting a public website status page with Uptime Kuma on a small Ubuntu VPS gives you complete control over both private alerting and public transparency:
| Capability / Feature | Uptime Kuma (Self-Hosted on VPS) | Typical Hosted SaaS Status Pages |
|---|---|---|
| Check Interval Speed | Down to every 20 seconds | 1 to 5 minutes on base tiers |
| Supported Monitor Types | HTTP(s), Keyword, JSON Query, Ping, TCP, DNS, Push, Docker | Mostly HTTP(s) and Ping (extra cost for TCP/DNS) |
| Public Status Pages & Custom Domains | Unlimited pages & custom subdomains included | Often restricted to 1 page or paid add-ons |
| SSL Certificate Expiry Display | Built-in public badge + private expiry alerts | Rarely shown on public status pages |
| Notification Integrations | 90+ built-in providers (Slack, Telegram, Discord, SMTP, etc.) | Limited by plan tier or webhook quotas |
| Server Resource Footprint | ~120 MB – 200 MB RAM in Docker | Cloud-hosted (paid per monitor/subscriber) |
Step 1: Deploy Uptime Kuma on a VPS with Docker Compose
For accurate uptime tracking, avoid hosting Uptime Kuma on the exact same machine as the primary website you are monitoring—if that single server loses power or network connectivity, your status page would go offline at the exact moment users need it. Running Uptime Kuma on a lightweight secondary Aveshost Ubuntu VPS (1 vCPU, 1–2 GB RAM) ensures independent external monitoring.
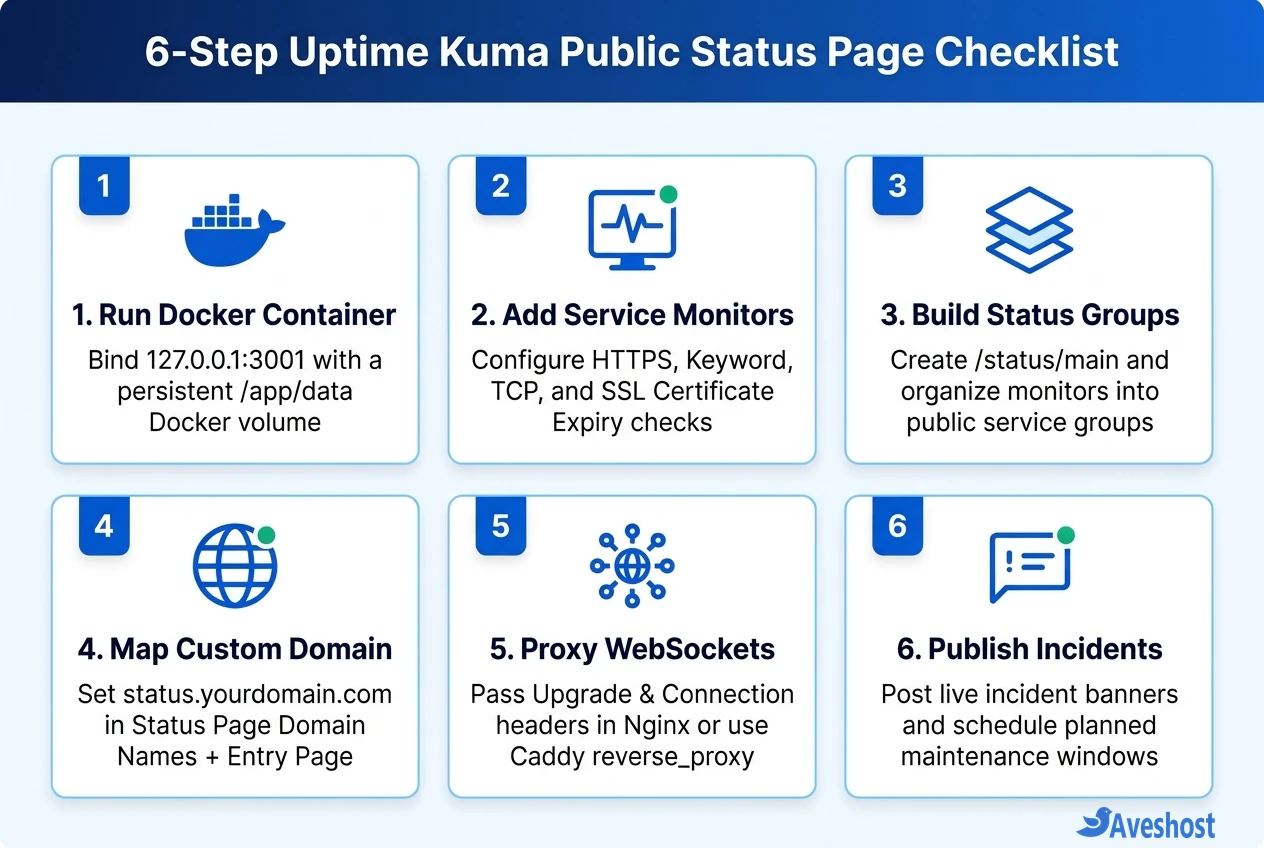
According to the official Uptime Kuma documentation, you should always mount a persistent volume to /app/data so your SQLite database, monitor history, and status page settings survive container upgrades.
Bind the container port to loopback (127.0.0.1:3001:3001) rather than 0.0.0.0:3001 so external traffic must pass through your HTTPS reverse proxy.
# 1. Create a dedicated directory for Uptime Kuma
mkdir -p ~/uptime-kuma && cd ~/uptime-kuma

# 2. Create docker-compose.yml with a persistent volume bound to localhost:3001
cat <<'EOF' > docker-compose.yml
services:
  uptime-kuma:
    image: louislam/uptime-kuma:1
    container_name: uptime-kuma
    restart: always
    ports:
      - "127.0.0.1:3001:3001"
    volumes:
      - uptime-kuma-data:/app/data

volumes:
  uptime-kuma-data:
EOF

# 3. Start Uptime Kuma in the background
docker compose up -d
Step 2: Create Website, API, and SSL Expiry Monitors
Before building your public page, populate Uptime Kuma with the underlying monitors you want to track. Only the display name, status badge, and heartbeat bar percentages are shown publicly—your raw target URLs, webhook secrets, and IP addresses remain private inside your admin dashboard.
Click + Add New Monitor in the top-left corner and configure these four core monitor patterns for a production stack:
• HTTP(s) — Keyword Monitor (Best for Websites & WordPress): Instead of a basic HTTP 200 OK check (which can pass even if a database error page renders), select HTTP(s) – Keyword, enter your website URL, and set a keyword from your footer or hero heading. Enable Certificate Expiry Notification so Uptime Kuma alerts you 7, 14, and 21 days before TLS renewal is due.
• HTTP(s) — JSON Query Monitor (Best for REST APIs): Point Uptime Kuma to your API’s /health endpoint (for example, a PocketBase backend or self-hosted Dify instance) and verify that the JSON response returns status: ok.
• DNS & Mail Port Monitors: Add a DNS monitor to verify your domain’s A and MX records resolve properly, and a TCP Port monitor on port 443 or 587 for critical services.
• Push / Heartbeat Monitor (Best for Backups & Cron Jobs): Select Push to generate a unique heartbeat URL, then append curl -fsS https://status.yourdomain.com/api/push/TOKEN?status=up&msg=OK to the end of your nightly backup script.
Step 3: Create and Customize Your Public Status Page
Once your monitors are collecting green heartbeats, you are ready to build your public website status page with Uptime Kuma:
• 1. Create a New Status Page Slug: Click Status Pages in the top navigation bar, then click + New Status Page. Enter a clear title (such as Aveshost Cloud Status) and a URL slug (for example, main, which creates /status/main), then click Next.
• 2. Organize Monitors into Service Groups: Inside Edit mode, click + Add Group to create logical sections such as Core Websites & Storefront, Customer APIs & Webhooks, and Email & DNS Infrastructure. Use the Add a monitor dropdown to assign each monitor to its group. You can click the gear icon next to any monitor to toggle public tag visibility or URL linking.
• 3. Customize Branding, Theme & SSL Badges: In the left sidebar, upload your brand logo, set a custom description and footer text, choose Light, Dark, or Auto theme, and toggle Show Certificate Expiry if you want visitors to see that your HTTPS certificates are valid. You can also inject custom styling in the Custom CSS box (such as matching your brand font or hiding the footer credit) before clicking Save.
Step 4: Map a Custom Domain and Configure WebSocket HTTPS
By default, visitors have to type https://status.yourdomain.com/status/main, while visiting the root URL https://status.yourdomain.com/ redirects to your private /dashboard login screen. Two settings inside Uptime Kuma fix this cleanly so your root subdomain loads the public status page directly:
• Add Your Subdomain to Status Page Domain Names: Open your status page, click Edit Status Page, locate Domain Names in the left sidebar, add status.yourdomain.com (without https://), and click Save.
• Set the Default Entry Page & Trust Proxy: Click your profile icon in the top-right corner, go to Settings > General, and under Entry Page select your status page (/status/main). Next, open Settings > Reverse Proxy, set Trust Proxy to Yes, and click Save.
Finally, point a DNS A record for status.yourdomain.com to your VPS IP address and configure Caddy or Nginx as an HTTPS reverse proxy. As noted in the Uptime Kuma Reverse Proxy Wiki, Uptime Kuma relies on Socket.IO WebSockets—if you use Nginx, you must pass the Upgrade and Connection "upgrade" headers or the status page will hang on a loading spinner.
# === OPTION A: Caddy Reverse Proxy (/etc/caddy/Caddyfile) ===
# Automatically provisions Let's Encrypt HTTPS and proxies WebSockets
status.yourdomain.com {
    reverse_proxy 127.0.0.1:3001
}

# === OPTION B: Nginx Reverse Proxy (/etc/nginx/sites-available/uptime-kuma) ===
server {
    listen 443 ssl http2;
    server_name status.yourdomain.com;

    ssl_certificate /etc/letsencrypt/live/status.yourdomain.com/fullchain.pem;
    ssl_certificate_key /etc/letsencrypt/live/status.yourdomain.com/privkey.pem;

    location / {
        proxy_pass http://127.0.0.1:3001;
        proxy_http_version 1.1;
        proxy_set_header Upgrade $http_upgrade;
        proxy_set_header Connection "upgrade";
        proxy_set_header Host $host;
        proxy_set_header X-Real-IP $remote_addr;
        proxy_set_header X-Forwarded-For $proxy_add_x_forwarded_for;
        proxy_set_header X-Forwarded-Proto $scheme;
    }
}
Step 5: Post Live Incidents and Schedule Maintenance Windows
A great status page does more than show automated green or red bars—it explains why a service is degraded and when planned upgrades will happen:
• Posting Live Incident Banners: Open your status page, click Edit Status Page, and click Create Incident at the top. Choose a severity colour (Info in blue, Warning in amber, or Danger in red), write a concise title and Markdown update (for example, Investigating elevated API latency in EU-West), and click Pin. Once resolved, click Unpin to clear the banner.
• Scheduling Planned Maintenance Windows: Before running server kernel updates or migrating containers with Dokploy or Coolify, click Maintenance in the top dashboard bar and select + Schedule Maintenance. Choose a one-time window or recurring cron schedule, attach the affected monitors and your public status page, and save. During the maintenance window, Uptime Kuma turns those monitors blue (Under Maintenance) on the public page and suppresses false-alarm downtime alerts.
Frequently asked questions
Does a public website status page with Uptime Kuma expose my admin dashboard or monitor URLs?
No. Visitors viewing your public status page only see the friendly monitor names, group titles, uptime percentages, and heartbeat bars you explicitly add to that page. Your underlying target URLs, IP addresses, authentication headers, and other unshared monitors remain locked behind your admin login.
How do I stop status.yourdomain.com from redirecting visitors to the /dashboard login page?
Do two things inside Uptime Kuma: first, open your status page in Edit mode and add status.yourdomain.com under Domain Names in the left sidebar. Second, go to Settings > General > Entry Page and select your public status page instead of Dashboard. Visitors hitting the root domain will then land directly on your status page, while admins can still log in at /dashboard.
Why is my Uptime Kuma status page stuck on 'Cannot connect to the socket server'?
Uptime Kuma uses Socket.IO WebSockets for real-time updates. That error happens when your reverse proxy (such as Nginx, Apache, or Cloudflare) blocks or strips WebSocket upgrade headers. In Nginx, add proxy_http_version 1.1, proxy_set_header Upgrade $http_upgrade, and proxy_set_header Connection ‘upgrade’ inside your location / block.
Can I host multiple public status pages for different clients on one Uptime Kuma instance?
Yes. You can create as many status pages as you need (such as /status/client-a and /status/client-b), assign different monitor groups to each page, and map a separate custom subdomain to each status page inside its Domain Names list.
Should I host Uptime Kuma on the same VPS as my main production website?
Ideally, no. If your main production VPS suffers a kernel panic, disk full error, or data-center network issue, an Uptime Kuma container running on that same machine will go offline too—preventing it from sending outage alerts or serving your status page. Running Uptime Kuma on a separate lightweight 1 GB or 2 GB RAM VPS guarantees independent external monitoring.